Data & Dashboards
Your business already has data. Make it useful.
A dashboard is not useful because it has charts. It is useful because it answers a question quickly. I help clean up the information behind the report, decide what is worth measuring, and make the result understandable to the people who actually use it.
Where I Help
Start with the problem, not the software.
The numbers live everywhere
Important information is split across spreadsheets, forms, exports, email, systems, and somebody’s personal tracking file.
Reporting takes too long
The same weekly or monthly report is rebuilt manually every time.
Nobody trusts the data
Different files show different answers, definitions are unclear, and people spend meetings arguing about whose number is right.
There is plenty of data but no answer
The business tracks activity without clearly seeing trends, workload, bottlenecks, conversion, inventory, service demand, or performance.
Dashboard Examples
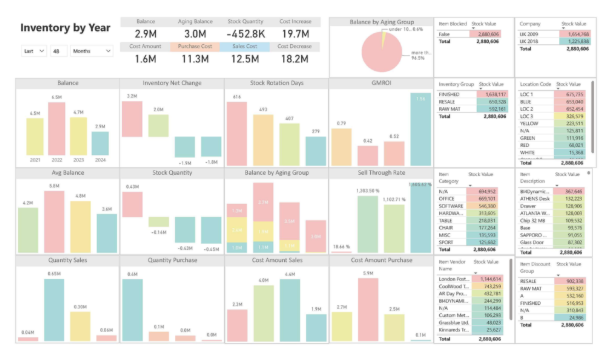
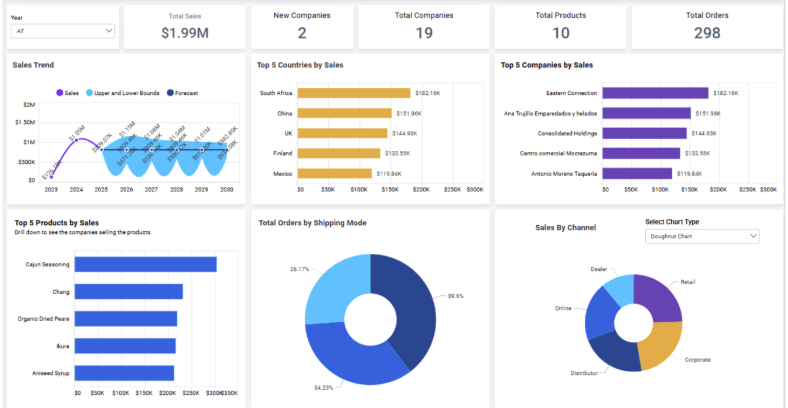
Examples of the kind of reporting I build.
These are supporting examples, not templates. The useful part is deciding what the business actually needs to see and making the data behind it reliable.
What Better Looks Like
Useful technology should make the business easier to run.
One clearer view
Bring the useful information together so people are looking at the same story.
Less manual reporting
Reduce repetitive copy/paste and rebuild work where it makes sense.
Metrics people understand
Define the measures in plain language so the dashboard is usable beyond the person who built it.
Better operational visibility
See what is changing, what is stuck, and where attention is actually needed.
What This Can Include
Built around what your business actually needs.
Dashboard design
Power BI, Looker Studio, spreadsheet dashboards, scorecards, and reporting views built around decisions.
Spreadsheet cleanup
Structure messy sheets, normalize fields, reduce manual work, and make the source data more reliable.
Operational reporting
Workload, intake, inventory, service demand, project status, customer activity, and process reporting.
Data definitions
Agree on what counts, where it comes from, and how it should be interpreted.
Recurring reports
Build repeatable reporting workflows instead of rebuilding the same report from scratch.
Audit-ready information
Organize source records and reporting so information is easier to trace, review, and explain.
Data & Dashboards FAQ
Before turning another spreadsheet into a dashboard.
Do I need Power BI?
Not necessarily. The right reporting tool depends on the data, who needs to use it, how often it changes, and what decisions the report needs to support.
Can you clean up an existing spreadsheet?
Yes. Sometimes the most valuable work is making the source data more consistent, easier to maintain, and less dependent on manual cleanup.
Can you automate recurring reports?
Often, yes. If the same report is rebuilt repeatedly from predictable data, there may be a better way to refresh or assemble it.
What if different reports show different numbers?
That usually means the definitions, sources, timing, or calculation rules need to be clarified before building another dashboard.
Can you build reporting for inventory or operations?
Yes. Operational reporting can cover inventory, intake, workload, project status, service demand, customer activity, bottlenecks, and other measures the business needs to see.
Do I need to know which metrics I want first?
No. Start with the questions you are trying to answer. The useful measures usually become clearer from there.
Not sure which service fits?